What is the Break Even Point?
Knowing your business's break even point is very important. Find out why the break even point matters, and how you can calculate it.
Updated on August 27th, 2020
The SMB Guide is reader-supported. When you buy through links on our site, we may earn an affiliate commission. Learn more
The break even point is the point at which a business is neither profitable nor in debt. In other words, all expenses have been paid, and enough money has been earned to settle all outstanding accounts. Any sales that are made after the break even point represent a profit.
Entrepreneurs typically conduct a break even analysis when they are starting a business to find out how long it will take them to go from carrying a loss to being profitable.
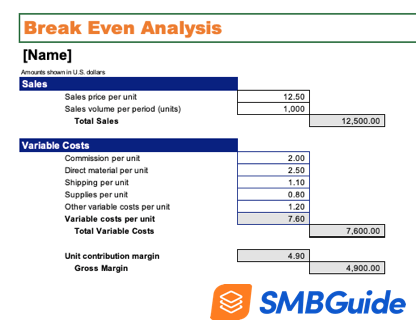
Break Even Analysis Template
With this free Microsoft Excel template, you can input all of your sales and financial data into a spreadsheet to find your break even point.
*When opening the download, click "Ignore" to keep the existing format and edit the spreadsheet.
How to Conduct a Break Even Analysis:
A break even analysis can be conducted using the break even formula:
Break even point = Fixed costs / (Unit selling price - Variable costs)
There are several parts in this formula that need to be defined so you can understand what goes into the final calculation:
- Fixed costs: These are necessary expenses that must be paid before your business starts operating. Fixed costs include things like office space, insurance, and equipment.
- Unit selling price: The price that you choose to sell each unit for.
- Variable costs: Recurring costs that are incurred with every unit produced. Variable costs may include raw materials and labor.
Now, let's look at a break even analysis example:
If you've done the math and determined that you have fixed costs of $10,000.00, variable costs of $1.00 per unit and a unit selling price of $5.00, you can plug these numbers into the formula.
Remember, Break even point = Fixed costs / (Unit selling price - Variable costs)
Step 1. Break even point = $10,000 / ($5 - $1)
Step 2. Break even point = $10,000 / $4
Step 3. Break even point = 2,500 units
You can see that by entering the information into the formula, we've determined that you need to sell 2,500 units to break even in this particular scenario.
Break Even Chart:
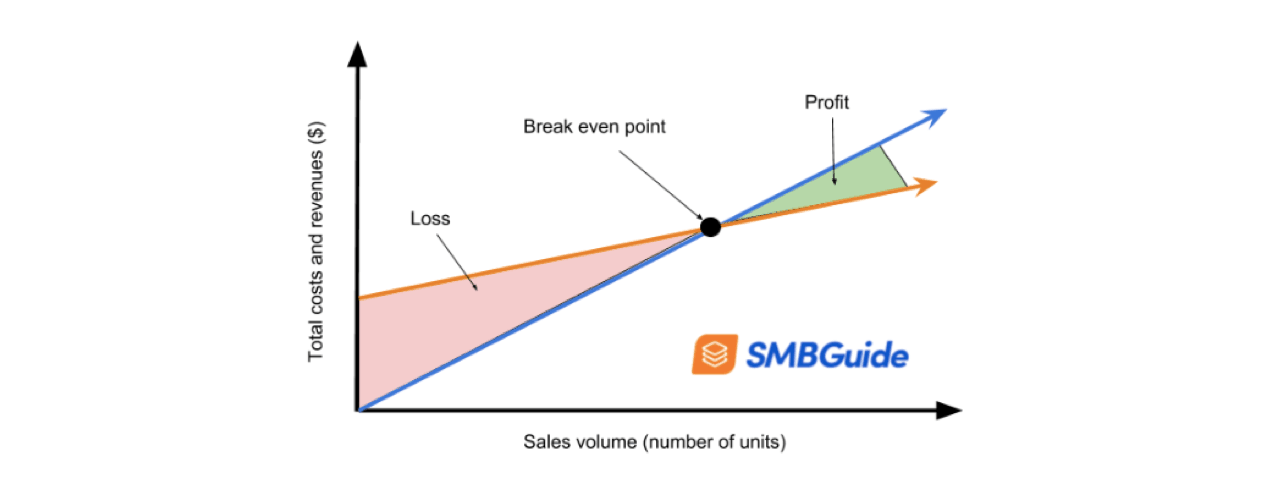
A break even chart visualizes the break even point on an X and Y axis. This can be helpful if you are trying to gauge your progress and see exactly how close your business is to breaking even.

As you can see, total dollars (revenue + cost) are recorded on the Y-axis, and the number of units sold is recorded on the X-axis.
A break even chart is a great way to summarize your break even analysis and give a visual depiction of your break even point.
The Bottom Line:
The concept of "breaking even" is fundamental to business. As an entrepreneur or small business owner, knowing your break even point and understanding how to get there will help you to plan ahead and set realistic sales goals.
Additional Resources:
FAQs:
How do you calculate your break even point?
Your break-even point can be calculated using this formula: Break-even point = Fixed costs / (Unit selling price - Variable costs).
What is the break even point?
The break-even point is when a business's income matches its expenses.
How is operating income calculated?
Operating income can be calculated by subtracting direct costs and indirect costs from your total revenue.
What is the formula for contribution margin?
The formula for calculating the contribution margin is: Contribution margin = Sales price of product - variable costs of product.
What happens after break even point?
After the break even point, profit is earned.
What is a break even chart?
A break even chart is a line graph that represents the point at which a business breaks even.
What causes a decrease in break even point?
A decrease in your break even point can be achieved by lowering costs or raising product prices.
What happens before the break even point is reached?
Before the break even point is reached, a business cannot settle any outstanding debt and no profit is being made.
How do you read a break even chart?
Costs and revenue are mapped along the Y-axis, and units sold are mapped along the X-axis.
What increases a break even point?
An increase in expenses or a drop in sales prices will cause an increase of your break even point.

What is the difference between Fixed Costs and Variable Costs?
Fixed costs stay the same regardless of production volume, while variable costs increase or decrease in direct proportion to the number of units that are produced.
Where can I find a break even point calculator?
You can use the break even formula to calculate your break even point: Break-even point = Fixed costs / (Unit selling price - Variable costs).
How long will it take my business to break even?
The break even analysis shows you how many sales you will need to make before your business breaks even, but it does not tell you how long it will take to get there. This depends on the rate at which you sell your goods or services.
What is the contribution margin?
The contribution margin is the difference between the unit's selling price and the total cost (fixed and variable) of producing the unit. Once the break even point is reached, the contribution margin represents revenue.

